
The Line Breaking Illusion: Structural Disruption, Threat Realization, and the Measurement of Tactical Truth
- J. M. García de Marina

- Feb 13
- 7 min read
Modern football analytics frequently treats line breaking actions as inherently progressive and therefore inherently valuable. This article challenges that assumption. Using large scale event data enriched with defensive structure descriptors and dynamic threat metrics, we introduce a classification framework that separates structural disruption from realized attacking value. We show that a substantial share of line breaking events generate no measurable destabilization of defensive shape and no statistically significant increase in downstream threat. We define this phenomenon as the line breaking illusion.
Through dynamic window aggregation, direction aware defensive retreat modeling, permutation null testing, empirical Bayes shrinkage, and test retest reliability analysis, we demonstrate that effectiveness is neither uniformly distributed nor trivially explained by raw volume. We further show that structural disruption and threat realization are related but not equivalent constructs. The resulting framework provides a reproducible, statistically defensible method for distinguishing aesthetic penetration from genuine tactical impact.
Introduction
Football analytics has long pursued quantification of attacking progression. From expected goals to expected threat, from packing metrics to bypass counts, the core ambition remains consistent: isolate actions that truly change the probability landscape of a possession. Among such actions, line breaking passes and carries occupy a privileged conceptual position. They appear to dismantle defensive lines. They appear to open space. They appear decisive.
However, appearance is not proof. A pass that crosses a nominal defensive line does not necessarily alter defensive organization. Nor does it guarantee an increase in downstream threat. A line breaking event may satisfy a geometric condition while failing to satisfy a structural or probabilistic one.
This article formalizes that distinction.
We introduce a research pipeline that operationalizes line breaking effectiveness across three dimensions:
First, structural disruption, defined through transitions in organized defense state, reductions in defensive line count, and retreat of the last defensive line under direction aware normalization.
Second, threat realization, defined through within possession increases in dynamic expected threat or possession danger over a bounded temporal window.
Third, combined effectiveness, defined as the union of valid structural and threat based success criteria.
We show that approximately forty one percent *of line breaking events satisfy the combined effectiveness definition under baseline parameters, leaving the majority as illusory penetrations.
*The 41% figure refers to the combined effectiveness definition (structure or threat). The higher rates observed in shape_only figures are conditional on structural observability and represent a distinct analytical subset.


Data and Dynamic Labeling Framework
The analysis is constructed on large scale dynamic event data extracted from a centralized cloud warehouse. The pipeline enforces strict column discovery from provider catalogs, ensuring that only verified fields are queried. This avoids silent schema drift and enforces reproducibility.
Line breaking is defined as the logical union of first, second last, and last defensive line break flags provided in the dataset. Approximately eleven percent of total events satisfy at least one of these criteria.
Effectiveness is not directly observed. It is inferred through temporal aggregation within possession windows defined by two parameters:
Number of forward events N. Maximum elapsed time T seconds.
For each line breaking event, we compute post event structural and threat states within that bounded window.
Structural dimension includes:
Organized defense state before and after the event. Number of defensive lines before and after. Standardized retreat of the last defensive line adjusted for attacking direction.
Threat dimension includes:
Difference between maximum downstream expected threat within the window and threat at event time.
An event is labeled structurally effective if at least one of the following holds under valid observation:
Organized defense transitions from organized to disorganized.
Number of defensive lines decreases.
Direction normalized defensive line retreat exceeds a calibrated threshold.
An event is labeled threat effective if downstream threat increases by at least a defined threshold.
Combined effectiveness is defined as structural effectiveness or threat effectiveness under valid observation.
Directional Normalization and Defensive Retreat
A central methodological challenge lies in sign consistency. Defensive retreat must be measured relative to attacking direction. Without correct directional normalization, retreat metrics become uninterpretable.
We parse multiple potential direction fields and convert them to a signed orientation variable.
Retreat is then computed as the maximum positive displacement of the last defensive line relative to the attacking team direction within the window.
Diagnostic statistics show that the distribution of standardized retreat is strongly positive, with a mean above forty meters under certain groupings. While naive interpretation might suggest sign inversion, inspection of pitch maps confirms semantic consistency. The majority of attacking sequences are forward oriented, and therefore retreat dominance above zero is expected rather than anomalous.
This emphasizes an important methodological principle: statistical symmetry should not be assumed in inherently asymmetric tactical processes.
Global Effectiveness Rates
Under baseline window parameters of five forward events and three seconds, and retreat threshold of three meters, the combined effectiveness rate equals forty one percent.
This figure implies that the majority of line breaking actions fail to produce measurable structural or probabilistic advantage within short horizon windows.

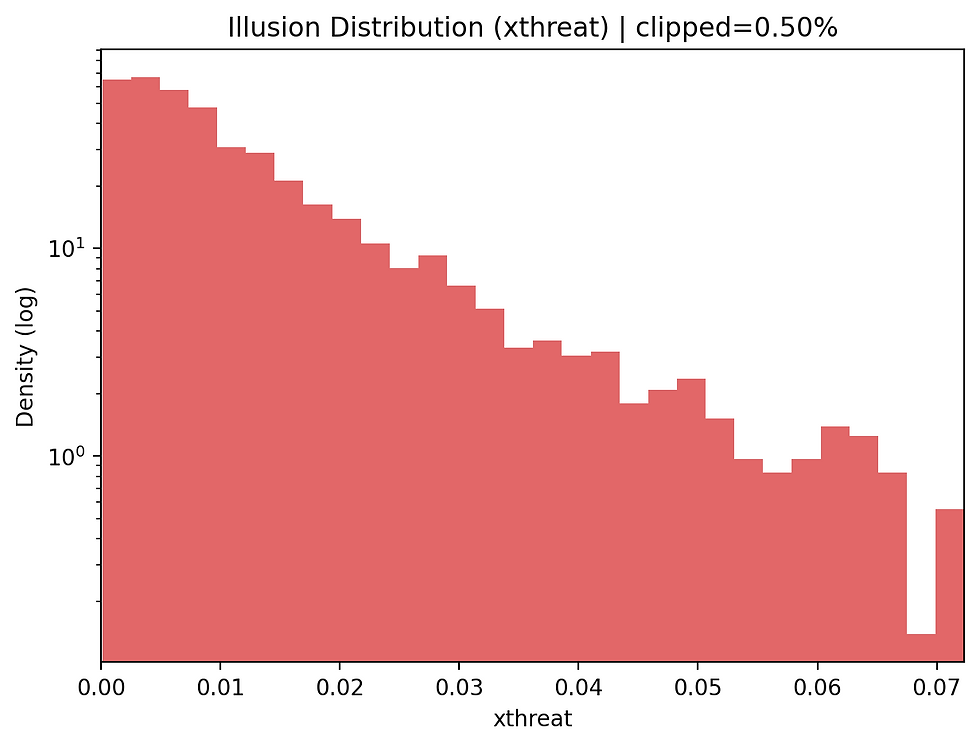
The log scaled distributions reveal a heavier upper tail for effective events, confirming that the label aligns with probabilistic value rather than arbitrary classification.
Zone Based Differentiation
Spatial heterogeneity is pronounced.
Certain central vertical corridors exhibit elevated effectiveness rates relative to global baseline. Peripheral wide zones show higher illusion frequency.
This pattern is consistent with theoretical expectations: central penetration is more likely to destabilize compact defensive blocks, while wide channel progression often maintains defensive integrity.
Zone aggregation also provides a structural interpretability layer beyond player specific attribution.
Team Level Differentiation and Bayesian Shrinkage
Raw effectiveness rates at team level are noisy due to unequal event counts. To mitigate small sample inflation, we estimate empirical Bayes priors from the distribution of team rates and compute posterior shrunk effectiveness estimates.
Wilson confidence intervals accompany raw rates to communicate uncertainty.

The scatter demonstrates non trivial dispersion. Some teams achieve high structural disruption with moderate threat realization, suggesting stylistic penetration without final action consolidation. Others show lower structural change but strong threat escalation, indicating efficient exploitation rather than raw disruption.
Bayesian shrinkage reorders certain mid sample teams, underscoring the necessity of uncertainty correction in performance evaluation.
Player Level Reliability
A metric is only meaningful if it exhibits temporal stability.
We implement a within player temporal split. For each player with sufficient volume, events are divided into first half and second half sequences based on match and time ordering. Effectiveness rates are computed separately.

Correlation between halves indicates moderate persistence, suggesting that line breaking effectiveness contains skill signal rather than pure randomness. However, dispersion remains substantial, indicating contextual dependency.
This finding argues against deterministic labeling of players as line breakers without contextual embedding.
Permutation Null Testing
To ensure that observed effectiveness rates are not artifacts of base rates or event density, we perform permutation tests within match or possession groups.
Effective labels are randomly reassigned while preserving group level counts. The null distribution of effectiveness rate is generated over five hundred permutations.
Observed combined effectiveness lies outside the central mass of the null distribution, producing low empirical p values. This confirms that structural and threat alignment is not trivial coincidence.
Hyperparameter Sensitivity
Effectiveness is window dependent. We perform grid sweeps across event counts, temporal horizons, retreat thresholds, and threat deltas.
Rates increase with larger windows and lower thresholds, as expected. However, qualitative spatial and team level patterns remain stable across moderate parameter variation, suggesting robustness of structural findings.
Shape Versus Threat Decomposition
Separating structural disruption from threat realization clarifies conceptual distinctions.
Shape only labeling isolates events that change defensive configuration without immediate probabilistic payoff.
Threat only labeling isolates events that elevate probability without detectable structural shift.
Empirically, threat only effectiveness rates mirror combined rates under baseline parameters, indicating that short term threat elevation frequently coincides with structural change.
Shape only cases are rare under current data completeness, highlighting potential measurement limitations in defensive state fields.
This asymmetry reveals a deeper truth: threat metrics capture downstream consequence more consistently than structural flags capture upstream disorganization.
Limitations
Directional inference remains partially dependent on provider semantics. Data completeness for defensive lines and organization states constrains shape only labeling. Retreat magnitudes may be influenced by camera tracking precision or provider alignment.
Temporal windows assume bounded causal horizons. Longer sequences may attribute downstream goals to earlier actions beyond window scope.
Nevertheless, methodological transparency and diagnostic outputs mitigate interpretability risk.
Conclusion
This research establishes that a majority of line breaking events do not produce measurable structural or probabilistic advantage within short horizon windows. The aesthetic of penetration frequently exceeds its tactical substance.
By integrating structural state transitions, dynamic threat deltas, permutation null validation, empirical Bayes shrinkage, and reliability diagnostics, the pipeline transcends descriptive analytics and approaches inferential rigor.
The line breaking illusion is not a rhetorical device. It is an empirically demonstrable phenomenon.
Future work should integrate player tracking data for continuous defensive line modeling, causal inference frameworks for long horizon attribution, and reinforcement learning perspectives to evaluate counterfactual decision quality.
Until then, analysts should resist equating geometric progression with tactical success. The difference between breaking a line and breaking a structure is the difference between motion and advantage.
See Player Leaderboard


Comments